
Understanding Measurement Uncertainty in Power Measurement
By Russel Lindsay, Anritsu Company

An engineer is cleaning out his garage lab one day and comes across an old oil lamp. As he’s rubbing off some stains to get a better look, a genie pops out. Grateful to be released from the lamp, the genie offers to grant the engineer three wishes. For his first wish, the engineer asks for a smartphone with a battery that never dies. POOF! A phone appears on the table in front of him with the letters “N/A” over the battery life indicator. Excited, the engineer asks the genie for a sports car that will instantly take him anywhere in the world. POOF! A red Ferrari appears in the driveway with the license plate “WHERE2”. For his final wish, the engineer decides he wants to get something really special for his garage lab, so he asks the genie for a power meter that always provides perfectly accurate power measurements. POOF! The engineer finds himself standing in a church with a note in his hands that says, “Miracles aren’t my department.”
Okay, so even with a little magic, finding a perfectly accurate sensor/meter isn’t going to happen. The key is understanding the uncertainty in the measurement you’re taking in order to determine if the product will meet your needs. Unfortunately, determining the measurement uncertainty of different sensors can be difficult. Not only are there several different factors that combine to make the overall measurement uncertainty of a power meter/sensor, but different manufacturers will not all use the same factors in their specifications of overall uncertainties.
The purpose of this article is to better define the different factors of measurement uncertainty, discuss their relative impact on overall uncertainty, and explain the important things to look for when picking a power meter and/or sensor.
Uncertainty Vs. Accuracy
A good place to start is understanding the difference between measurement uncertainty and measurement accuracy, since some datasheets use one and some use the other. The scientific difference is rather complex, but simply stated, accuracy is a measurement of variation (or lack thereof) from known standard.
If you put a known signal of 0 dBm into a power sensor, accuracy would be how closely to 0 dBm that sensor reads. Unfortunately, it’s impossible to know for sure that the standard signal is exactly 0 dBm; there is no source to test against that doesn’t have some uncertainty of its own. Your sensor may read 0 dBm on the dot, but if it turns out the measured signal is actually 0.7 dBm, then you’re not actually getting an accurate measurement.
Measurement uncertainty is a similar concept, but instead of trying to define the accuracy of the measurement, it tries to quantify the impact of different factors on the overall reading to some statistically significant confidence level. In reality, most datasheets are actually specifying measurement uncertainties. To really understand what’s being listed, dig through the notes of the datasheet and look for the terms noted in this article.
Mismatch
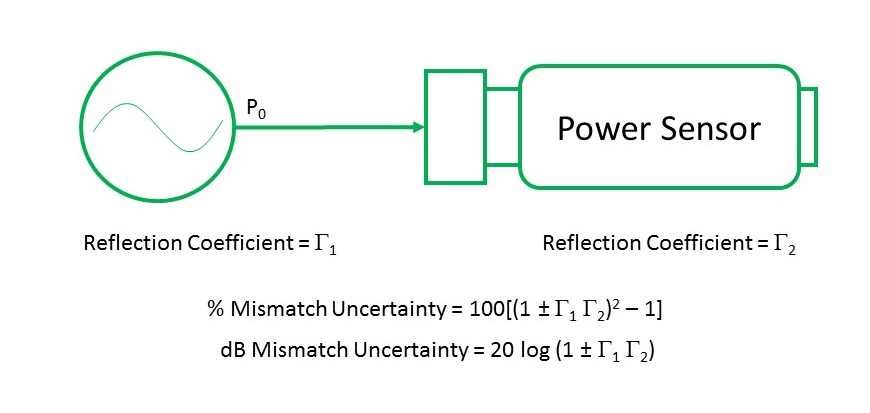
Impedance matching is usually the highest contributor to measurement uncertainty, especially at higher power levels, where noise is less of a factor. Mismatch causes wave reflections, which result in constructive and/or destructive interference to the measured signal. Power sensors are designed to have very good impedance match, so usually the majority of the uncertainty is caused by the standing wave ratio (SWR) of the device under test. In extreme mismatch situations, a 3-10 dB precision attenuator can be added to the front of the sensor, but use discretion, because adding another element to the system could add more mismatch or uncertainty than it avoids.
Connector cleanliness and damage can be a major factor in mismatch uncertainty, as well, so it is critical to fasten connectors to the correct torque levels (as found in most product manuals).
Mismatch uncertainty can be easily calculated with the reflection coefficients of the sensor and device under test (DUT), as shown in Figure 1.
Noise
Noise is simply the effect of unwanted signals on your measurement system. In power measurement, the noise floor of the sensor is usually derived mostly from the power-sensing element. The impact of noise on the uncertainty of the measurement greatly depends on the signal being measured.
A signal at the high end of the sensor’s power range is farther away from the noise floor, and therefore easier to detect. That makes the noise impact on uncertainty very small. As you get closer to the bottom end of the detector’s power range, though, it becomes more difficult for the sensor to differentiate between the intended signal and the noise. Instead of capturing samples from the signal, some samples will just be noise, which will add greater uncertainty to the measurement.
The impact of noise on a particular sensor will depend on the type of sensor used. Diode sensors typically have a lower noise floor, which will allow them to accurately capture signals at a lower power than thermal sensors. However, some diode sensors have multiple paths to keep the measured signal within the square law region of the diode (these are often called “True RMS” sensors, like the Anritsu MA24218A USB Power Meter). As the signal changes, the sensor will automatically switch to the path that keeps the signal within the square law region of the measuring diode. Whenever the signal is at the low end of a diode’s measurement range, the impact of noise will be higher. Datasheets will lay out the impacts of noise in different ranges (if necessary), so it’s important to look closely at possible differences.
The impact of noise can be mitigated by increasing the number of averages taken to produce a power reading. This makes it more likely that the power reading is based on samples from the intended signal and not from unwanted noise. The tradeoff to greater averages is a decrease in overall measurement speed.
In some cases, it may also be possible to prevent the sensor from switching to another power range where the impact of noise might increase. The caveat here is that the linearity of the sensor’s readings will degrade if your measurement moves out of the square law region of the detector diode.
Zero Set And Drift
Almost all sensors require zeroing on a regular basis when measuring lower level signals close to the noise floor of the sensor. This is done when there is no signal input to the sensor, essentially telling the sensor that any RF power being read is noise, and should not be measured as part of a signal. The random nature of noise makes it impossible to remove altogether, but regular zeroing goes a long way toward improving the accuracy of the measurement. The baseline set by zeroing can drift over time, though, which will add noise (and therefore uncertainty) to the measurement. The best way to minimize this uncertainty is to regularly zero the sensor.
Calibration Factor Uncertainty
Calibration factor uncertainty is the accuracy of the sensor’s calibration relative to a recognized standard for absolute power level. Sensor calibration factor uncertainty is included in accuracy calculations for any absolute power measurement (in dBm or Watts), and for relative power measurements if the signals are different frequencies. As mentioned earlier, it’s impossible to perfectly specify the accuracy of a sensor, because you don’t know the accuracy of the source it’s measured against. Calibration factor (cal factor) uncertainty is how we account for that. After mismatch, this is probably the second-highest contributor to overall uncertainty (when noise is not a huge factor).
Organizations like that National Institute of Standards and Technology (NIST) hold gold standards for measuring things like power. These are the baselines for all measurement tools (so if we’re all wrong, at least we’re all wrong in the same direction). Even then, most calibrations that are performed are several steps away from the gold standard. Each step adds a little uncertainty to the equation. Cal factor data can usually be obtained at the time of purchase of any new sensor and/or after any calibration.
Reference Power Uncertainty
Most benchtop power meters come equipped with a reference calibrator. This essentially outputs a signal at a known power level and frequency into the sensor. The meter can then read the sensor output and adjust for any loss that might be introduced from cabling between the sensor and the meter. Again, it’s impossible to guarantee the accuracy of the reference signal, so reference power uncertainty is simply a measure of the uncertainty added to the system after a reference calibration.
Sensor Linearity
Sensor linearity describes the relative response of the sensor to power inputs over the entire dynamic range. Essentially, it is measuring how closely the power meter reading will track corresponding changes in power from the device under test. Temperature linearity is also included when operating the sensor at other-than room temperature, and will usually be laid out in the sensor datasheet.
“Instrument Accuracy”
Finally, you might see a specification for “instrument accuracy.” This is not a measure of how accurate your power reading is; rather, it is an attempt to specify the uncertainty introduced by components within the instrument. The RF signal being measured will travel from its output through diodes, amplifiers, analog-to-digital converters, more amplifiers, etc., before a power reading is given. Each of those components has imperfections that might add to the uncertainty of the measurement. Manufacturers will, of course, do their best to minimize the impact, but there will still likely be some impact to the overall measurement.
Uncertainty Calculators
With so many factors possible contributing to the uncertainty of a power measurement, it can seem daunting to account for them all. Some companies, such as Anritsu, offer uncertainty calculators to help their customers determine uncertainty under various measurement conditions.
Conclusion
You will never get rid of all measurement uncertainties. The key is to pick the right meter/sensor, then quantify and minimize the uncertainties inherent in your individual systems. Things like noise and mismatch can be greatly reduced with the right settings and designs, while drift, cal factors, linearity, and accuracy can be accounted for in the overall measurement expectations.
By studying the datasheets and properly designing your system, you will have a solid grasp on your power measurements. Then, maybe next time you come across a genie in a bottle, you can use your third wish on something a little more fun.