Testing Frequency Multipliers and Dividers

•Introduction
•Common Measurement Techniques
•Fast Swept Frequency Techniques
•Conclusion
Frequency multipliers and dividers are key components of modern radio frequency (RF) and microwave systems. They are generally used in signal generation and frequency synthesis applications. These devices can be awkward to characterize due to the frequency conversion between input and output - several pieces of test equipment are usually needed.
This paper reviews current techniques for measuring the main parameters of multipliers and dividers, focusing on areas where special considerations are required. In particular, output return loss and phase noise are covered. The application of a microwave system analyzer to multiplier and divider measurements is introduced. Several examples are given to illustrate fast measurements of conversion gain suitable for tuning and manufacturing environments.
The most basic measurement setup consists of a signal generator and spectrum analyzer. This can be used in an elementary fashion to determine the following parameters.
- Operating window (Input power and frequency)
- Output power
- Output harmonics
Measuring these parameters manually over a band of frequencies can be a laborious process and it is common to perform a quasi - swept measurement using a sweeper and the maximum hold facility on the spectrum analyzer. This works well as long as the harmonics of interest do not overlap.
Phase noise measurements
The phase noise of multipliers and dividers is a major concern especially when they are the building blocks of frequency synthesizers. The output phase noise of a multiplier or divider is ideally given by

where LIN and LOUT are single sideband phase noise expressed in decibels with respect to the carrier in a 1Hz bandwidth (dBc/Hz). Dividers improve the phase noise whereas multipliers degrade it. In real devices, the output phase noise is limited by a noise floor. This can be measured by many methods, but most of these require a reference signal significantly better than the device under test.
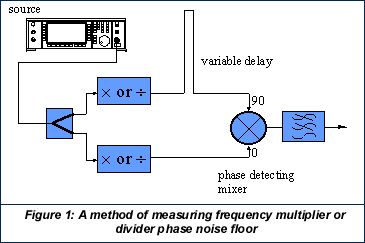
This problem can be overcome with a quadrature mixing method where the devices are measured in pairs (Figure 1). The signal generator phase noise adds to both paths of the measurement, but by adding a variable delay into one of the paths is canceled at the phase detector, leaving just the sum of the additional noise from the two devices. If three devices are available, they can be measured in all combinations to reveal the noise of each individual device. It is particularly important to ensure that only the desired output harmonic reaches the phase detector. The phase detector can be calibrated with a beat note method using another signal generator to drive one of the devices.
Input and output return loss
Complex RF subsystems are often designed by a team of engineers. To reduce integration problems when the building blocks are connected together, input and output return loss are commonly specified for each block of circuitry.
The input match of a divider or multiplier can be measured over the input frequency range using any conventional technique, for example an autotester (return loss bridge) and scalar analyzer. When using a broadband device such as an autotester to measure multipliers and dividers beware of backfire of the output frequency or harmonics causing errors. Ensure that the power at the device input is correct during the measurement, as the input match is a function of input level.
When measuring output return loss, it is important that the multiplier or divider is in its normal operating state. A small signal measurement with an autotester or vector network analyzer (VNA) may give false results, as the operating conditions of the non linear parts of the device will be different. Figure 2 shows a possible set-up. The device output is used as excitation for the measurement. A mismatched line is used to reflect power back to the device and the standing wave pattern is used to determine the output match.
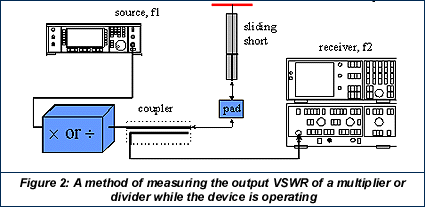
If the output is loaded with a variable phase short circuit, problems can arise with some devices, especially digital dividers, which could stop running. In this case, a pad can be inserted before the short to provide a controlled mismatch. The forward power on the line is sampled with a directional coupler. By adjusting the length of the mismatched line, the maxima and minima of the standing wave can be observed on a spectrum analyzer tuned to the output frequency. The ratio of maximum to minimum is the voltage standing wave ratio (VSWR) on the line. The return loss of the device under test is given by

where Lpad is the loss of the pad in dB. Errors in this measurement can be analyzed with reference to the flow graph shown in Figure 3.
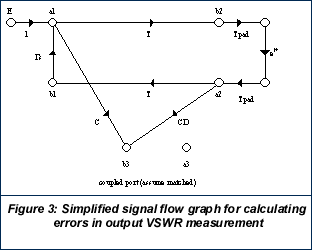
DUT reflection coefficient Gs
Coupler transmission coefficient T
Coupling coefficient C
Coupler directivity D
Pad transmission coefficient Tpad
Sliding short reflection angle P
The sliding short is modeled as lossless. The analysis will not be included, but the main result is summarized in the following table. This assumes no pad.
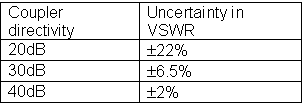
As a rule of thumb, the coupler directivity needs to be 10 to 20dB better than the output return loss being measured.
Automated measurements
Considerable time can be saved by automating the preceding measurements with general purpose interface bus (GPIB) compatible instruments and a controller. This technique is very flexible, and a system can be contrived to measure almost any parameter versus frequency, power, time etc.
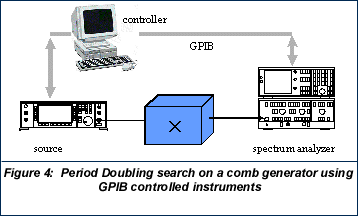
As an example, Figure 4 shows a relatively simple set-up to search for an interesting characteristic in a comb generator. The time varying capacitance in a step recovery diode (SRD) based comb generator makes it easy to inadvertently produce a parametric amplifier. The parametric gain can cause peaks in the noise floor, or even oscillations, generally at half the input frequency, and is often referred to as period doubling instability. In trying to construct a multiplier, a divider has been produced!
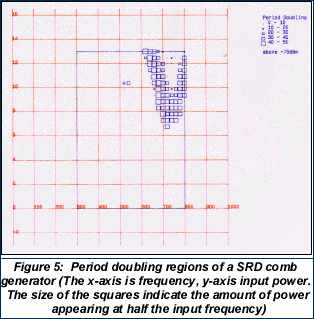
Considerable difficulties can be experienced in proving the effect has been eliminated as it happens over a narrow range of drive levels and frequencies. A GPIB controlled system can plot regions of period doubling against frequency and drive power - a typical result is shown in Figure 5. This can save substantial development time.
Fast swept frequency techniques
RF engineers like to see plots of characteristics against frequency. Even continuous wave (CW) multipliers need to be characterized over frequency to allow for component tolerances and temperature change. For manufacturing, real time tuning and rapid development applications, fast swept measurements are desired.
A scalar analyzer can be used to measure divider and multiplier output power, but the high levels of harmonics can cause large errors with broadband detectors. Most spectrum analyzers with tracking generators and vector network analyzers cannot handle frequency conversion devices without external hardware.
What is needed is a synchronized source and receiver with the required frequency relationship.
Microwave system analyzers
The Microwave System Analyzer (MSA) is new class of instrument which provides the solution by combining a signal generator and spectrum analyzer with an inbuilt controller (Figure 6). In addition, a high accuracy scalar analyzer is included.
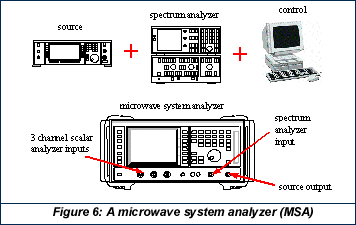
In most tracking generators, the signal is derived by mixing the spectrum analyzer local oscillator (LO), which only allows frequency offsets to be generated. However if the source and receiver are independently generated, any frequency relationship can be obtained. With a MSA the relationship between the source and receiver frequencies is determined by a scale and offset control. The instrument can be configured into two modes: spectrum analyzer with full band tracking generator (to 24GHz), and scalar analyzer with a tuned receiver input.
In spectrum analyzer mode, the frequency range at the receiver is entered and the source frequency is scaled and offset. The instrument acts like a spectrum analyzer with a scaled and offset tracking generator. This mode is convenient for measuring dividers as the scale is simply the divide ratio.
In scalar analyzer mode, the source frequencies are entered and the receiver frequency is scaled and offset. This is convenient for frequency multipliers, where the scale is the harmonic number. The instrument acts like a scalar analyzer, except the input is tuned and of high dynamic range. The tuned input can be combined with scalar detectors to measure conversion gain.
Example measurements on frequency multipliers and dividers using a MSA
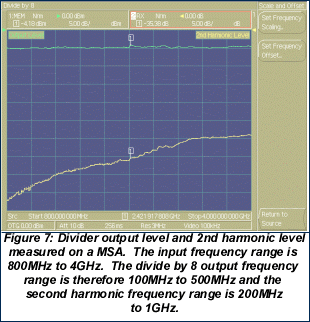
As an example of the spectrum analyzer mode, Figure 7 shows a screen shot of a measurement of the output power of a frequency divider (divide ratio = 8). The MSA scale control has been set to 8 such that the source tracks at 8 times the spectrum analyzer frequency. The frequency scale is annotated in source frequency units. The plot is overlaid with a swept measurement of the output second harmonic level (i.e. scale = 4).
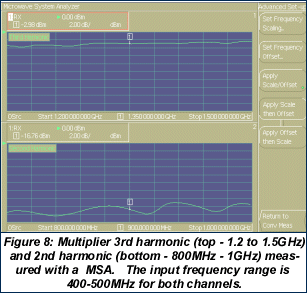
As an example of the scalar analyzer mode, Figure 8 shows a comparison of the 2nd and 3rd harmonic measurement of a multiplier. A balanced multiplier is used, which generates a signal rich in odd harmonics and suppresses even harmonics. A dual channel measurement is shown. The measurements are live, and swept alternately. The scale control on each channel has been set equal to the required harmonic number. For example, the 2nd harmonic channel has scale set to 2 such that the spectrum analyzer frequency is always twice the source frequency. The scales are annotated in spectrum analyzer units (output frequency).
Measurement accuracy and calibration
The uncertainties in multiplier and divider conversion measurements must be considered separately at the input and output as the frequencies are different. At the device input, the source level accuracy, cable loss and source match are the dominant factors in uncertainty of incident input power. At the device output, receiver level accuracy, load match and cable loss limit the accuracy of the output level measurement.
The input cable loss can be compensated for by performing a user power calibration at the end of the cable. The instrument automatically sets the front panel level high enough to compensate for the cable loss. The source match can be improved by increasing the power level and adding 50 ohm attenuators.
A through path calibration can be performed over the source or receiver frequency range. The choice depends on the uncertainties at each side of the device under test. The receiver level accuracy is generally worse than the source level accuracy and a calibration over the receiver frequency range is most suitable. This reduces the spectrum analyzer reference level uncertainty to approach that of the source.
Characterizing integrated assemblies containing frequency multipliers and dividers
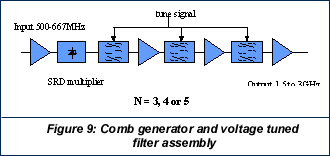
Frequency multipliers and dividers are rarely stand alone devices, and are usually part of an integrated system. As an example, Figure 9 shows a comb generator and voltage tuned filter assembly. This circuit takes the VHF signal from a high quality oscillator and selects the 3rd, 4th or 5th harmonic to provide a 1.5 to 3GHz signal.
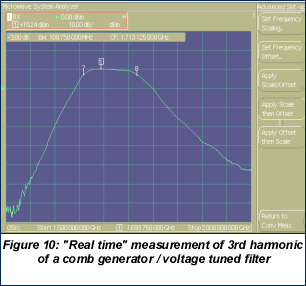
A MSA can be used to perform a swept measurement of the entire signal chain. The speed of the measurement allows the effect of adjustments to the circuit to be seen in "real time". Figure 10 shows the 3rd harmonic response of the signal chain measured on a MSA - the response can be observed as the voltage tuned filters are adjusted.
This paper has reviewed techniques for measuring the key parameters of frequency multipliers and dividers. In particular methods for measuring phase noise and output match have been studied. The flexibility of GPIB controlled techniques was illustrated with the example of a period doubling search on a comb generator.
Fast, swept frequency measurements can be made using a microwave system analyzer. It has been shown how this instrument can be used to measure the output level and harmonics of multipliers and dividers. In this application, the instrument is faster and more convenient than using a separate signal generator and spectrum analyzer, which is important in tuning and manufacturing environments. It is also superior to using a scalar analyzer as the tuned receiver can be used to reject unwanted harmonics.
<%=company%>
