Predistortion Helps Improve Power Amp Linearity: Part I
By Frank Zavosh, Mike Thomas, Chris Thron, David Runton, Motorola Semiconductor Products Sector (SPS)
Contents
Quantifying non-linearity
AM/AM and AM/PM distortion
A look at QAM
Common linearization technique
System setup
Measurement setup
Wrap up
Spectral efficiency and high-power efficiency have become significant factors in design of cellular and PCS products. These requirements are achieved partly through the use of linear digital modulation techniques, and saturated high efficiency power amplifiers (PA).
This is the first part in a two-part set on digital predistortion techniques used in power amplifier designs for wireless applications. Part I of this article will provide an overview of problems associated with PA non-linearity in systems employing digital modulation with non-constant envelope. Specifically, the article will look at quadrature phase-shift keying (QPSK) and quadrature amplitude modulation (QAM) schemes due to their extensive use in today's modern digital communications systems.
QPSK and QAM modulation techniques, although spectrally efficient, produce modulated carriers exhibiting substantial envelope fluctuations. This envelope fluctuation results in signal distortion and spectral spreading when the modulated carrier is passed through an efficient saturated PA. In order to reduce these deleterious effects while meeting the power and spectral efficiency requirements, linearization techniques can be used. In Part 1, we will also demonstrate a digital predistortion system used in linearizing the PA.
Quantifying non-linearity
The amplifier non-linearity can best be quantified by studying the constellation diagram of the modulated signal passing through the PA. Both phase and amplitude distortions will be apparent once the PA output is downconverted and results are displayed on an oscilloscope. Furthermore, phase and amplitude distortion will give rise to frequency regrowth at the output spectrum of the PA. To illustrate these effects, the output constellation and frequency spectrum of the PA will be measured under non-linear operating conditions for both PSK and QAM modulated signals.
Let's start by considering a p/4-differential QPSK (DQPSK) modulated signal. This modulation scheme is commonly used in many commercial wireless systems on the market today, due to its spectral efficiency and simple modulator/demodulator construction.
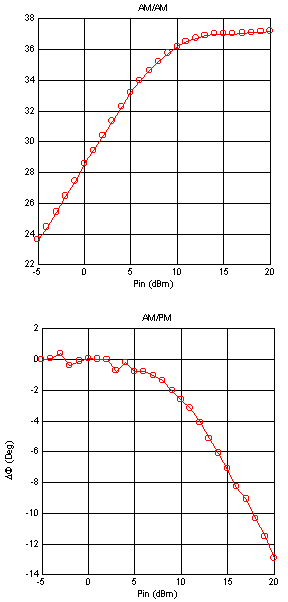
An MHW19338 4W laterally diffused metal-oxide semiconductor (LDMOS) PA is used for our experimental analysis. The measured AM/AM and AM/PM response of this PA is obtained using the VNA (Figure 1).
AM/AM and AM/PM distortion
The PA output constellations for three different input power levels are shown in Figure 2. Note that since the constellation points for p/4-DQPSK are equally spaced from the center, any AM/AM effect caused by PA compression will be hard to detect on the constellation diagram. The AM/PM response of the PA, however, will be clearly evident as a rotation of the constellation points. This distortion in the PA output signal can result in substantial increase in bit error rate (BER) at the receiver, hence, substantially degrading the performance of the system.

As illustrated in Figure 2, as the PA is operated beyond its linear region, the constellation rotates in a counterclockwise direction, with a small rotation for Pin = +10 dBm and a much larger rotation for the Pin = +20 dBm. The relationship between input power level and phase rotation could be easily predicted by looking at the AM/PM response of the PA and calculating the peak power level of the input signal.
As previously noted, when using a p/4-DQPSK modulation scheme, AM/AM effects are hard to detect in the PA output constellation due to the equal spacing of the constellation points from the center of the constellation. The effect of PA AM/AM on the power spectral density (PSD) is much more dramatic, however. This effect is illustrated in Figure 3, where the PSD of the PA output is shown for the same input power operating points used in the constellation diagrams.
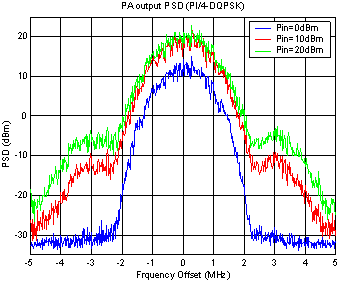
The adjacent channel interference (ACI) level has increased by more than 17 dB from the linear case Pin = 0 dBm, to the highly saturated case Pin = +20 dBm. This increase in ACI is generally not acceptable due to the requirements on out-of-band emissions set by the FCC.
A look at QAM
QAM is another common modulation technique used in modern communications systems due to its bandwidth efficiency. The effect of PA non-linearity on the constellation of a 16-QAM signal is shown in Figure 4.
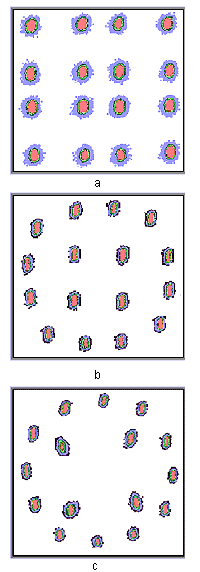
As the PA is operated beyond the linear region Pin = +10 dBm, the effect of PA AM/AM response can be observed by the distortion of the outer points of the constellation into a circular formation. Note that at this operating point not a great deal of AM/PM effect is observed, since the inner constellation points are not distorted.
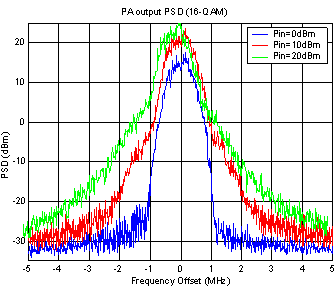
As the PA is moved further into saturation Pin = +20 dBm, substantial AM/PM effect is also observed as is evident by the distortion of the inner constellation points. The power spectral density (PSD) of the PA output for the 16-QAM modulated signal is shown in Figure 5 for the three different input power levels described above. As in the p/4-DQPSK, a substantial increase in adjacent channel interference (ACI) is observed as the PA operating point is moved from linear to saturation.
Common linearization technique
Predistortion is one technique commonly chosen in both analog and digital form to achieve better amplifier linearity. In this method, a nonlinear element preceding the PA is used with gain expansion characteristics that cancels the gain compression of the amplifier.
In the digital implementation of predistortion, the non-linear element is achieved easily and accurately in software. In addition, this method can compensate for any order non-linearity and any modulation format, making it applicable to a wide array of wireless systems1. The availability of high-speed digital signal processors (DSPs) in recent years has also made digital predistortion a viable approach for wideband applications such as CDMA and wideband CDMA (W-CDMA).
The digital predistortion used in our analysis is based on a simple algorithm developed in MATLAB, which multiplies the original baseband I and Q signals with appropriate predistortion coefficients stored in a lookup-up-table (LUT). The computed predistortion coefficients are based on the AM/AM and AM/PM response of the PA obtained empirically, and the operating point of the amplifier. An optimum operating point is calculated through and iterative process in the MATLAB routine, and is a function of the peak power level of the input signal.
In the system illustrated below, a feedback loop is not used to compensate for temperature and time varying system parameters. However, in most system some level of LUT update will be necessary over time.
System setup
The block diagram of the system used in our experimental analysis is shown in Figure 6. In this system, the digital baseband signals are generated on a PC and transmitted to an arbitrary waveform generator (AWG) for digital-to-analog conversion.
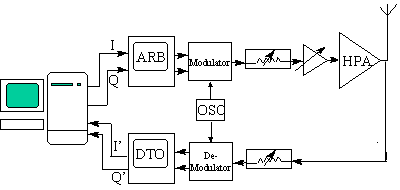
The AWG output is fed to a direct conversion transmitter for upconversion to an RF frequency (1.9 GHz). The modulated carrier signal is passed through a series of voltage-controlled attenuators (VCAs) and driver amplifiers to provide linear input power to the PA over a wide dynamic range.
Both PA input and output ports are connected to a spectrum analyzer, to ensure the linearity of the input signal and to measure the ACI levels of the output signal. The PA output is downconverted to baseband and passed to a digital oscilloscope for analog-to-digital conversion.
The constellation diagram of the digitized signal is displayed on the oscilloscope. Any phase or amplitude distortion in the downconverted signal is quantified by comparing the output constellation with the input constellation.
Measurement setup
For the measurement setup, the PA transfer functions used in evaluating the predistortion coefficients are obtained empirically. The transfer functions are quantified in terms of AM/AM and AM/PM responses measured using a vector network analyzer (VNA). The AM/AM response is computed from the magnitude of the S21 and the AM/PM is obtained from the phase of the S21 scattering parameter. The S21 of the PA is measured while the input power signal is swept.
For the theoretical analysis, the signals at various stages in the system are represented in terms of complex baseband envelopes. The simulated system is configured to match the lab setup as accurately as possible. The gain and loss of various components in the lab setup are accurately measured and added to the program to correlate the results of the simulation with that of the measured data. These measurements help to accurately estimate the instantaneous power level at the input of the PA, so that the best operating point for the predistorted signal is easily adjusted for in the simulation.
Wrap up
This concludes Part I in our two-part series on predistortion techniques for RF PA designs. Part II of this article will appear in two weeks and will focus on how digital predistortion cab be used in both QPSK and QAM systems to improve the PA non-linear response.
References
1. Jeckeln, E.G., Ghannouchi, F.M., Sawan, M., "Linearization of Microwave Emitters using an Adaptive Digital Predistorter," 27TH European Microwave Conference Proceedings, pp. 336-340, Sep. 1997.
2. Saleh, A.A.M., Salz, J., "Adaptive Linearization of Power Amplifiers in Digital Radio Systems," Bell Systems Tech. Journal, vol. 62, No. 4, pp. 1019-1033, Apr. 1983.
3. Cavers, J., "Amplifier Linearization Using a Digital Predistorter with Fast Adaptation and Low Memory Requirements," IEEE Trans. on Vehicular Technology, " Vol. 39, No. 4, pp. 374-382, November 1990.
4. Lothia, A., Goud, P.A., Englefield, C.G., "Power Amplifier Linearization using Cubic Spline Interpolation," Proc. 43TH IEEE Veh. Tech. Conf., pp. 676-679, May 1993.
5. Kenington, P.B., "Linearised RF Amplifier and Transmitter Techniques," Wireless Systems International, 1998.
6. Wright, A.S., Durtler, W.G., "Experimental Performance of an Adaptive Digital Linearized Power Amplifier," IEEE Trans. on Vehicular Technology, " Vol. 41, No. 4, pp. 395-400, November 1992.
7. Faulkner, M., Johansson, M., "Adaptive Linearization Using Predistortion-Experimental Results," IEEE Trans. on Vehicular Technology, " Vol. 43, No. 2, pp. 323-332, May 1994.
8. Razavi, B., RF MICROELECTRONICS, Prentice Hall, 1998.
9. D'Andrea, A.N., Lottici, V., Reggiannini, R., "A Digital Approach to Efficient RF Power Amplifier Linearization," IEEE Trans. , pp. 77-81, 1997.
10. D'Andrea, A.N., Lottici, V., Reggiannini, R., "RF Power Amplifier Linearization Through Amplitude and Phase Predistortion," IEEE Trans. on Communications, Vol. 44, No. 11, pp. 1476-1484, Nov. 1996.
11. Park, I., Powers, E.J., Xu, G., "Parallel Adaptive Predistortion for RF Power Amplifier Linearization," Proceedings of the IEEE, pp. 82-86, 1997.
12. Sundstrom, L., Faulkner, M., Johansson, M., "Quantization Analysis and Design of a Digital Predistortion Linearizer for RF Power Amplifiers," IEEE Trans. on Vehicular Technology," Vol. 45, No. 4, pp. 707-719, November 1996.
About the authors:
Frank Zavosh, RF Design Engineer; Mike Thomas, RF Design Engineer; Chris Thron, Systems Engineer; David Runton, RF Design Engineer, Networking and Computing Systems Group, Motorola Semiconductor Product Sector, 2100 E. Elliot Road, Tempe, AZ 85284. Phone: 480-413-6617; Fax: 408-413-4433.
Edited by Robert Keenan
