
Phase Noise Cause And Effect — Part 1: Communications
By Howard Hausman, president and CEO, RF Microwave Consulting Services
Phase noise is a parameter that affects many electronic systems, such as radar and communications. In radar, phase noise can hide doppler signals and, in communications, it has the potential to point a symbol vector to the wrong location. Understanding the mechanism causing phase noise helps the design engineer avoid the pitfalls of this phenomena.
Introduction

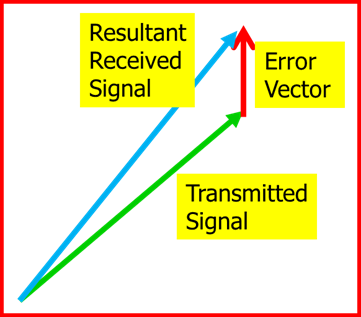
Electromagnetic signals used in communication systems are voltage vectors that carrier amplitude and phase information (see figure 01-01). Spurious signals and thermal noise are modeled as an error vector added to the tip of the transmitted signal vector distorting the original amplitude and phase information (see figure 01-02).
If the error vector is thermal noise, the resultant vector has an uncertainty in amplitude and phase. This uncertainty dominates at low signal amplitudes, i.e., low Signal to Noise Ratios (SNR).
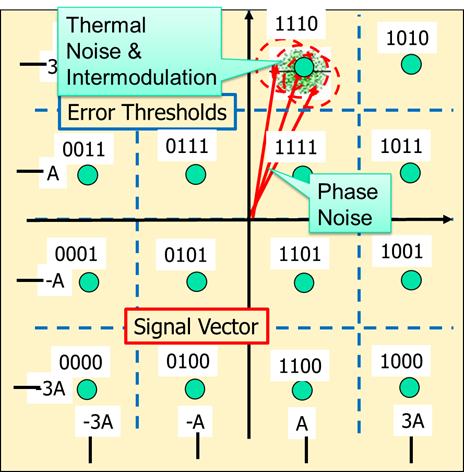
A typical communication system converts baseband data to the desired carrier frequency by mixing the baseband signal with a local oscillator. Phase noise occurs in every active component in the transmitter and receiver chain but is most pronounced in the oscillators used to up-convert the signal to the transmit frequency and the oscillators used to down-convert the received signal back to baseband. The effect of phase noise varying the angle of the originally transmitted vector is shown in Figure 01-03. Phase noise generated in and part of the up-converter oscillators and down-converter oscillators is independent of signal level and therefore is an issue over the entire communications link’s operating dynamic range.
Phase Noise Effect On Bit Error Rates (BER)
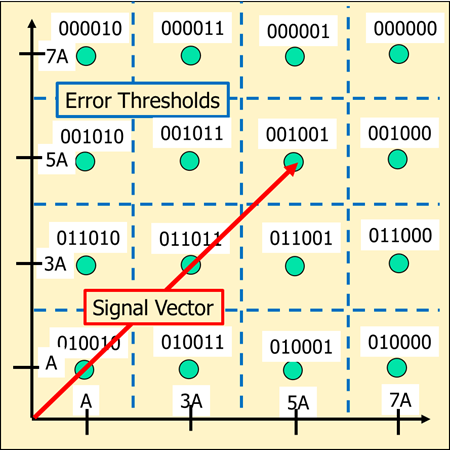
Communication systems rely on complex “Vector Modulation” constellations to increase a links effective data rate. The signal carrier, a voltage vector with a defined amplitude and phase, points to a single symbol in a constellation of symbols. Each symbol represents a collection of bits where the number bits is a function of the complexity of the constellation. Figure 01-04 is one quadrant of a 64QAM (Quadrature Amplitude Modulation) constellation (64 QAM has of 64 Symbols locations, 16 symbols per quadrant). In 64QAM, the vector pointing to a symbol represents 6 bits of data. Figure 01-04 shows a transmitted vector (shown in red) pointing to a 6-bit word symbol, 001001. The blue dashed lines describe an area around that point that identifies where a received vector must reside to report the correct transmitted word. A bit error is avoided when the sum of all error vectors does not drive the transmitter vector beyond the respective thresholds.
Figure 01-03 shows a 16QAM constellation (4 bits per symbol) and Figure 01-04 shows a 64QAM constellation. Observing both constellations, it is obvious that the less dense constellation (16QAM with 4 bits per symbol) is more forgiving in terms of allowable phase noise than the 64QAM constellation (6 bits per symbol).
Spectral Density Of Phase Noise
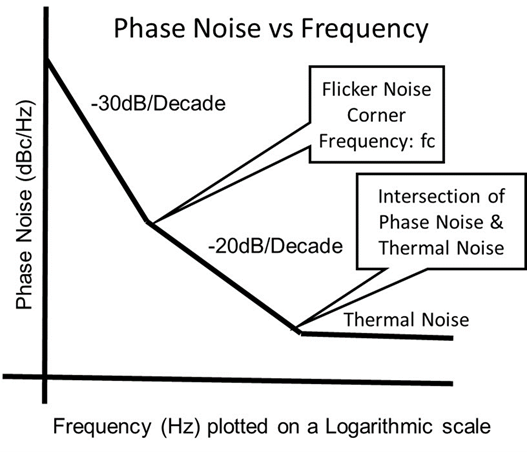
Note: Flicker noise has a spectral density decreasing at a rate of 1/f (-10dB per decade), where “f” is the frequency offset from the carrier. The effects usually observed at low frequencies are associated with a DC current flow.
Figure 01-06 is a typical plot of a calculated Phase Noise Spectral Density function. The flicker noise corner frequency is 1kHz offset from the carrier. The thermal noise plateau is not shown because thermal noise is a system function and not known until the relative position of the oscillator with respect to the other components in the system are known and analyzed.

Note on the effect of flicker noise on the phase noise plot: The spectral density response close to the carrier 10Hz to 100Hz decreases at a rate of 30dB per decade, and the spectral density response at 10kHz to 100kHz decreases at a rate of 20 dB per decade.
Notes on the phase noise spectral density plot: Phase noise spectral density plots are typically “single side band” offset from the carrier. The amplitude is expressed in dBc/Hz, i.e., dB with respect to the carrier measure in a 1 Hz bandwidth. And, dBc/Hz is not an algebraic equation.
Conclusion
The preferred method for the transmission of digital data is vector modulation. It relies on the amplitude and phase of the carrier signal pointing to a constellation symbol where each symbol represents a word, i.e., a collection of bits. The denser the constellation, the more digital bits per symbol and the more efficient the data is transferred. The limiting factors of a constellation’s density are (1) fixed signal distortions through the link, (2) Adjacent channel interference, (3) thermal noise, and (4) phase noise. Discussed here is the issue of phase noise, a critical limiting factor present at all signal levels. The amplitude of the spectral density with respect to the carrier (dBc) generally increases as the carrier frequency increases. Understanding characteristics, cause and effects of phase noise is critical to designing an efficient and robust communication system.
Part 2 of this series on phase noise will discuss the relationship between the noise spectral density plot and the actual vector angle error in degrees RMS, the ultimate factor of concern in minimizing bit error rates (BER).
References
- Ham, D., “Statistical Electronics, Noise Processes in RF Integrated Circuits (Oscillators and Mixers)”, Harvard RF and High-Speed IC & Quantum Circuits Laboratory, 2003.
- Grebenkemper, C. “Local Oscillator Phase Noise and its effect on Receiver Performance”, Watkins-Johnson Company Tech-notes, 1981.
- V. Agrawal and F. Dai, “RFIC Design and Testing for Wireless Communications, Lecture 4: Testing for Noise”, TI India Technical University, July 2008.
- Custom MMIC Tech Brief, “Addressing Phase Noise Challenges in Radar and Communication Systems.”
About The Author

Howard Hausman is the president and CEO of RF Microwave Consulting Services and an adjunct professor at Hofstra University. Hausman received his BSEE & MSEE degrees from NYU Tandon School of Engineering. Formerly, Hausman was CTO, VP of Engineering, and president and CEO of MITEQ, Inc., where he specialized in designing and analyzing communications systems, microwave power amplifiers, and microwave components and systems for satellite communications, space systems, radar, electronic warfare (EW), and reconnaissance systems. Hausman is a recipient of an NYU Distinguished Alumni Award, the IEEE LI Alex Gruenwald Award, and a NASA award for work on the Mars landing system. Hausman has written many technical papers and lectured around the world on satellite communications, microwave power amplifiers, and microwave components and systems.