Measuring Site Noise
When working with customers on their RF interference problems here at the Bird Technologies Site Optimization Services group, at some point in the process we usually have to quantify the amount of environmental RF noise present at the site. Often, we will receive a call from a technician in the field, and the call may go something like this:
Customer: My system is being degraded by a high level of external noise.
Bird: How high is the external noise?
Customer: It is about -100 dBm.
Bird: At what bandwidth did you make that measurement?
Customer: I don’t know. Does that matter?
Now this is a made-up call of course, and we don’t mean to disparage any specific person or customer, but the fact here is, when measuring noise with a spectrum analyzer, the resolution bandwidth (RBW) used for the measurement is as important as the level of noise displayed on the screen in dBm.
Noise Measurement Theory
The measurement of noise power is not as straightforward as the measurement of signal power. Signal power is easily measured with a spectrum analyzer. Within reasonable and practical limits, the bandwidth of the instrument has only minimal effect on the measured power level of a correlated signal.
As long as the bandwidth is wide enough to admit 90% of the signal’s carrier and first order sidebands and narrow enough to prevent admitting significant amounts of energy from adjacent signals, the accuracy of the reading will be well within 1 dB plus or minus the accuracy of the instrument. Depending upon the signal’s characteristics, analyzer RBWs between 3 and 30 kHz will provide acceptable levels of accuracy for narrow band land mobile signals.
Noise, on the other hand, is not so forgiving. The displayed level of uncorrelated, random noise will change in direct proportion to the measurement bandwidth. If the noise amplitude is -120 dBm in a 10 kHz bandwidth, the same noise will measure -110 dBm in a 100 kHz bandwidth. If the bandwidth is increased to 1 MHz, the noise amplitude will increase to -100 dBm. In short, the measured noise power, (expressed in dBm), will change at a rate equal to 10* LOG (BW1/BW2) or 10 times the log of the ratio of the bandwidths. Failure to consider this effect has led to numerous mistakes and misconceptions regarding noise interference issues.
For example: One technician measures the noise on a given frequency at a communications site using a spectrum analyzer set to 1 kHz RBW. The analyzer displays a value of -100 dBm. He declares that the noise level is a little high but acceptable for the proposed system. After installation, a second technician measures the same frequency at the same location with an analyzer set to a 100 kHz RBW. He reads a noise value of -80 dBm and declares that there is a serious noise problem at the site.
Who is right? Who is wrong? The truth is that they are both correct and incorrect. The two values are actually equal when the measurement bandwidth is considered. If we convert the bandwidth relationship to dB by the formula 10 * LOG (100 kHz/1 kHz), we get 20 dB. We can then use that value to adjust either reading to match the bandwidth of the other. To convert, or scale, the noise value measured at 1 kHz RBW to a 100 kHz bandwidth, we simply add 20 dB to the value measured at 1 kHz RBW. The result is -80 dBm. The same process can be applied to the reading taken at 100 kHz RBW. We can easily adjust the 100 kHz reading to a 1 kHz bandwidth by taking 10 * LOG (1 kHz/100 kHz) and adding it to the measured value. In this case, we have -80 + (-20 dB) = -100 dBm. As a result, we can see that both technicians actually measured the same noise power, only the bandwidth changed.
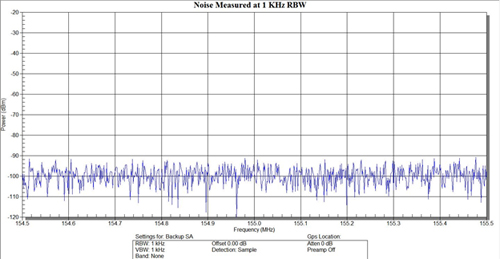
Figure 1 below shows a noise source being measured with a Bird Signal Hawk spectrum analyzer set to a 1 kHz RBW. Since this is only noise and there are no signals present, it is easy to see that the noise averages approximately -100 dBm.
Figure 1: Noise at 1 kHz RBW. CLICK TO ENLARGE.
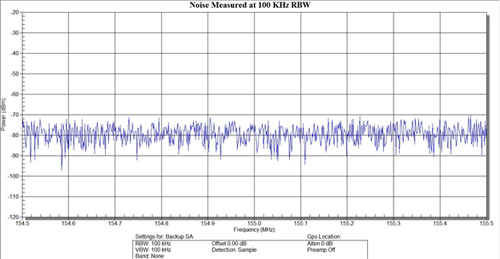
Figure 2, below, shows the exact same noise source, measured with the same instrument with all parameters the same except the resolution bandwidth (RBW), which has been increased to 100 kHz.
We see in figure 2 that the noise level now averages approximately -80 dBm, 20 dB higher than the measurement made at a 1 kHz RBW. This increase in noise power level due to a 100-to-1 increase in bandwidth agrees exactly with our previous calculations.
Figure 2: Noise at 100 kHz RBW. CLICK TO ENLARGE.
This still leaves us with one unanswered question; how much will the noise level at the site impact the system performance? To answer this question, we need to convert the noise measurement into the same bandwidth as our proposed receiver. If we know the equivalent noise bandwidth (ENBW) of the receiver, we can simply insert that value into the previous equation as the desired bandwidth (numerator) and place the measured bandwidth into the denominator. Assuming the proposed system is a digital system with a receiver ENBW of 5.4 kHz, we have:
NRX = -100 dBm + 10 * LOG (5.4 kHz/1 kHz)
NRX = -92.7 dBm @ 5.4 kHz ENBW
Now we have a noise level that we can properly compare to the receiver system’s internal noise to determine the amount of impact the noise may have on the system performance, if any.
Obviously, the next step requires us to determine the internal noise level of the receive system. One way to do this is to use the measured static sensitivity to compute the receiver’s internal noise. If the receiver system has a measured sensitivity of -119 dBm for 5% bit error rate (BER), we can determine the system’s noise by simply subtracting the sensitivity criteria, or Cs/N, from the static system sensitivity. The sensitivity criterion is the carrier-to-noise ratio required to produce the stated performance, in this case 5% BER. For a typical digital system, this is around 7.6 dB. In other words, we need a signal 7.6 dB above the receiver’s noise to produce 5% BER.
If -119 dBm produces 5% BER, then:
-119 dBm – 7.6 dB = -126.6 dBm
Therefore, -126.6 dBm is the level of the receiver system’s noise.
Now that we have determined that the receiver’s noise is equal to -126.6 dBm, we can compare that value with our site noise of -92.7 dBm and clearly see that our system operation will be degraded. To determine the amount of degradation, we have to add the site noise of -92.7 dBm to the receiver’s internal noise of -126.6 dBm to obtain the receiver’s composite noise.
-92.7 dBm + -126.6 dBm = -92.69 dBm (see note below)
Please note, in the equation above you cannot add dBm directly as shown. The actual calculation was performed by converting the values back into watts, adding them together and then converting the results back into dBm. The intermediate steps were eliminated for clarity.
In this case, the external site noise is sufficiently higher than the receiver system noise and becomes the dominant noise source with the receiver’s noise adding little to the overall noise level when expressed in dBm. Therefore, the receiver’s noise floor, including the external site noise, is -92.7 dBm. If we now add the sensitivity criteria of 7.6 dB Cs/N, we can obtain the effective receiver sensitivity (ERS).
-97.2 dBm + 7.6 dB = -85.1 dBm
Comparing the receiver static sensitivity of -119 dBm to the ERS of -85.1 dBm, we see that the site noise has degraded the receiver 33.9 dB.
-85.1 dBm – (-119 dBm) = 33.9 dB
The purpose of this rather lengthy example was to demonstrate the dramatic impact that bandwidth can have on the projected degradation when the bandwidth of the noise measurement is either not stated or stated improperly. Our first technician obtained a site noise value of -100 dBm. This would have produced an ERS of -92.4 dBm. Comparing that to the receiver’s static sensitivity of -119.0 dBm, we would have projected degradation of about 27 dB.
-92.4 dBm – (-119 dBm) = -26.6 dBm
Using the noise measurement from our second technician of -80 dBm, we would have computed an ERS of -72.4 dBm, which represents a degradation in excess of 40 dB, when in reality, the degradation is actually 26.6 dB.
-72.4 dBm + -119 dBm = -46.6 dB
If either the noise level measured at 1 kHz RBW or the noise level measured at 100 kHz RBW had been used to predict the system receive performance of the system, both predictions would have been seriously flawed. The first would have been about 10 dB too much optimistic and the second about 10 dB too conservative. If this was a proposed multisite system, one scenario would have produced a system with too few sites and ultimately poor coverage, and the second scenario would have produced a design with too many sites, possibly making it prohibitively expensive and causing the vendor to lose the sale.
From this example, we can draw two conclusions. First, it is absolutely necessary that all noise measurements include the measurement bandwidth. Simply stating that “the site noise is -100 dBm” is totally insufficient because without the bandwidth you really don’t know anything about the actual noise level. Second, in order to determine the impact on a receiver’s performance, the measurement bandwidth of the external noise MUST be the same as the receiver’s ENBW.
And that’s a Bird’s eye view.
About The Author
Alfred T. Yerger II is an RF engineering specialist for Bird Technologies, specializing in field engineering for the land mobile industry, including antenna site design, noise and interference, and communications system coverage issues.
Mr. Yerger has been working in the radio communications and broadcast industries since 1974, including 18 years with Motorola Communications. He joined Bird Technologies in January 2005, after running his own business, Antenna Site Technology Inc., for 6 years. He is the senior engineer in Bird’s Site Optimization Services (SOS) department. In this position, Mr. Yerger is responsible for supporting Bird’s spectrum monitoring and noise measurement services, interference mitigation, and training for the land mobile communications industry.


