
Basics Of Power Measurement — Average Or Peak?
By Russel Lindsay, Anritsu Company
A power sensor walks into a bar and the bartender says, “I’m glad you’re here; I need to take a measurement. Can you take a peek?” And the sensor responds, “No sorry, I’m only an average power sensor.” Ba-dum-ching! Get it? Peek versus peak… but he’s only an average sensor…? Okay, admittedly, it’s not that funny, but by the end of this article it will at least make sense.
When setting up a test system, it’s critical to know the types of measurements you want to perform in order to select the right equipment. In the world of power measurement, one can easily be confused by the different types of sensors and their varying measurement capabilities. Parsing through some of the terminology can help make the selection process easier.
Average Or Peak?
Like the one in the joke, many power meters or sensors have the terms average or peak in their description, but those two terms aren’t as intuitive as they seem. To really understand the different types of measurements, you’ll want to dig a little deeper. The following terms can help us understand the difference between peak and average sensors, and their capabilities:
- Instantaneous power
- Envelope power
- Peak envelope power
- Burst average power
- Average power
The example of a pulse modulated signal in Figure 1 helps to illustrate these definitions:

The first term, Instantaneous power, P(t), is the actual power of the signal at any given time. On a test instrument, it would look like a reproduction of the waveform. Capturing instantaneous power requires instrumentation that can react fast enough to capture the rapid changes in the signal. Most power meters/sensors are not fast enough, so a high-speed digitizer or digital storage oscilloscope (DSO) would be required. In most cases, when someone is referring to a “peak” power measurement, they are referring to peak envelope power and not the peak instantaneous power.
Envelope power, Pe(t), is the amplitude change due to modulation, or sometimes distortion, and is another measurement as a function of time. Envelope power is not a re-creation of the waveform itself, but a representation of the average power over the sensor aperture interval at any point in time (see Figure 2 for another example of the relationship between envelope power and instantaneous power).
The peak envelope power, PEP, is the highest single power measurement from within the envelope power readings. Detecting the PEP correctly requires that the modulating signal’s change in amplitude is at a rate within the video bandwidth of the sensor. Note that power meters often provide crest factor or peak-to-average power ratios (PAPR). In this case, the peak power is actually PEP, rather than instantaneous, peak power. More on video bandwidth and crest factor later, though. The burst average power, PBAvg, simply is the average power from within just the burst. Capturing these three values requires a peak power sensor, like Anritsu’s MA2411A Pulse Sensor or MA24105A Inline Peak USB Sensor.
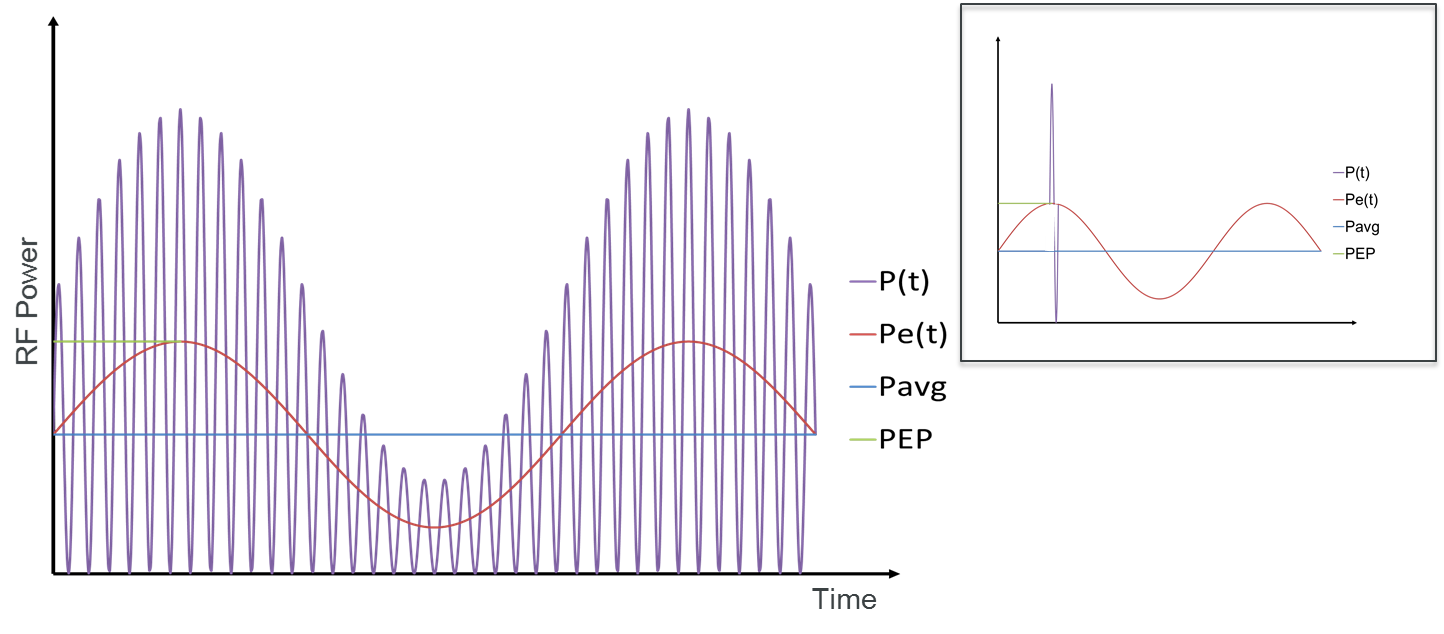
The last value in our list is the average power, Pavg (represented by the purple line in Figure 1), which is the average power taken over a specified period of time. In our example, it is during the period from the beginning of one burst to the next (also known as the pulse repetition interval, or PRI). This is the measurement you will get from average power sensors, like Anritsu’s MA24208A/18A Universal USB Power Sensors. These particular diode-based sensors are sometimes referred to as true-RMS sensors, because they are designed to keep the measured signal within the square-law region of the diode — where the DC output of the sensor circuit has a strong linear relationship to the square of the applied RF voltage. This allows them to accurately measure the average power of most signals, including modulated, multi-tone, or pulsed signals. For unmodulated signals (i.e., continuous wave or CW), sensors like Anritu’s MA247xD and MA244xD series can operate in all three diode ranges (linear, transition, and square-law) to determine average power.
Note that, although the average sensor cannot measure the peak power of the modulation, in some cases you can still use it to determine certain characteristics of the burst. For instance, in the pulse signal example used in the diagram, the burst average power can be determined, as long as you know the duty cycle of your signal. In this case, the PBAvg is equal to Pavg divided by the duty cycle, where the duty cycle is the pulse width divided by the pulse repetition interval.
Crest Factor
As mentioned earlier, some sensors will provide a crest factor, which is the ratio of average power to peak envelope power. Be sure to watch out for signals with a high crest factor; the average power may not be accurate if the peak power is beyond the measurement range of the sensor. It’s also possible to damage test instruments with a high enough peak power, even if the average power is within the specified limits.
Video Bandwidth
One last important term to remember when choosing between peak and average sensors is video bandwidth. A common misconception is that the video bandwidth must always match the modulation frequency in order to make an accurate power measurement. This is only true when capturing peak power measurements. If you’re using an average or RMS sensor, the video bandwidth is mostly irrelevant to its ability to make the measurement you need.
Applications
With a better understanding of the definitions, it’s time to ask yourself which measurements you need for your specific application. Peak measurements will be important when you are trying to characterize modulated signals, like radar or LTE, or in the R&D lab for design verification. For example, someone characterizing a radar signal may be interested in the signal rise and fall times, any overshoot that may exist, or whether or not the signal droops during the pulse. For communication signals, engineers may want to know that the signals are transmitting at correct power levels in order to avoid distortion, or to comply with regulatory demands.
Average power readings will suffice for any CW signal or in settings where the modulated signal has been characterized well enough that an average power reading will provide sufficient information to verify proper operation.
Summary
Selecting the right power sensor can be a challenge, even when just choosing between average and peak sensors. Understanding the difference between the two types of measurements is key to picking the right one. A quick study of the different power measurement terms can help you make an informed sensor purchase, or just prepare you for the next time you encounter one in a bar.
In the next installment, we will review the uncertainties associated with power measurements to help you understand how confident you can be in your results.
About The Author

Russel Lindsay is a product manager for Anritsu Company, specializing in power measurement and signal generation. Russel has worked in test and measurement for the last four years, prior to which he spent time in various engineering roles in aerospace and defense, from system engineering and test to R&D design. He holds a Bachelor of Science in Electrical Engineering from the University of Utah and a Master of Business Administration from Arizona State University.